CICD improvements
— Testing, Github Actions, CICD — 4 min read

From my experience in the industry, I've grown a strong belief that CICD pipelines are never really finished. Eventually new requirements come in and add functionality to the current solution. These improvements then add runtime to every build and teams find ways to speed up the existing components to bring faster iteration cycles for their deployments. In this post I tried doing both of these by adding caching to my Gatsby components and also implemented Lighthouse to give better insights into the blog's performance.
If you didn't checkout my previous blog about how the blog is setup you can find it at cloudkrunch.com/the-cloudkrunch-blog. This goes over the original CICD pipelines that I'll be iterating on in this post.
If you don't know what Lighthouse is you can find an overview of everything it offers here.
Adding Gatsby caching
This was a pretty easy tweak that is high in value. Reducing the time it takes to iterate on build pipelines saves time during development but also on the cost to run pay as you go infrastructure!
I added this step in my build job in the Github action:
- name: Caching Gatsby dependencies id: gatsby-cache-build uses: actions/cache@v2 with: path: | public .cache node_modules key: ${{ runner.os }}-gatsby-website-${{ github.run_id }} restore-keys: | ${{ runner.os }}-gatsby-website-Doesn't really get much easier than that.
Lighthouse post deployment
I added this simple way of checking how the website ranked after deployment. You certainly could add deployment gates to this by deploying to staging and running the Lighthouse testing before production promotion, but I didn't feel like it was necessary yet for my simple static website.
What I wanted to know:
- Where is the performance at right now?
- If you didn't read my prior post, this website is hosted with AWS CDN with caching. This should help serve the content quickly
- Are there any known vulnerabilities?
- I used a Gatsby template to create this blog and not everything on the internet is great
- Are there any low hanging fruits that can improve the site?
With that in mind I set up some simple parameters for Lighthouse to check, they are called "Budgets".
[ { "path": "/*", "timings": [ { "metric": "interactive", "budget": 3000 }, { "metric": "first-meaningful-paint", "budget": 1000 } ], "resourceCounts": [ { "resourceType": "third-party", "budget": 0 } ] }]Here I'm checking 3 things:
- That the site is interactive (able to use it) in 3s (3000ms)
- The site starts to render something within 1s
- That the site makes 0 calls out to third party services
My blog doesn't have any outbound calls to services yet, so I just wanted to confirm that.
I ended up finding a Github Action I could use to run Lighthouse called treosh/lighthouse-ci-action@v9. It was written
by the company that worked with Google on the Lighthouse project so I felt good using it.
Here's what needed to be put in my Github Action:
lighthouse: runs-on: ubuntu-latest needs: build steps: - uses: actions/checkout@v3 - name: Audit URLs using Lighthouse uses: treosh/lighthouse-ci-action@v9 with: urls: | https://cloudkrunch.com/ https://cloudkrunch.com/blog budgetPath: ../assets/budget.json # path to budgets.json uploadArtifacts: true # save results as an action artifacts temporaryPublicStorage: true # upload lighthouse report to the temporary storage runs: 3For this action I opted to use the temporaryPublicStorage option so it didn't cost me anything. With this flag it will host your results in GCP for free, but Google will use it for analytics. For me, I was ok with that because this was being done on my public site post deployment, so these results could be found by anyone running this on my site. I wanted to point out that with this configuration I'm only testing my homepage and blog page. It didn't feel necessary to test the performance of my specific blog posts right now. Also, I'm running the test 3 times because on the first run the cache will most likely not be set (unless someone visits between deploying and the test running), so I want to make sure the cache plays a factor in the results.
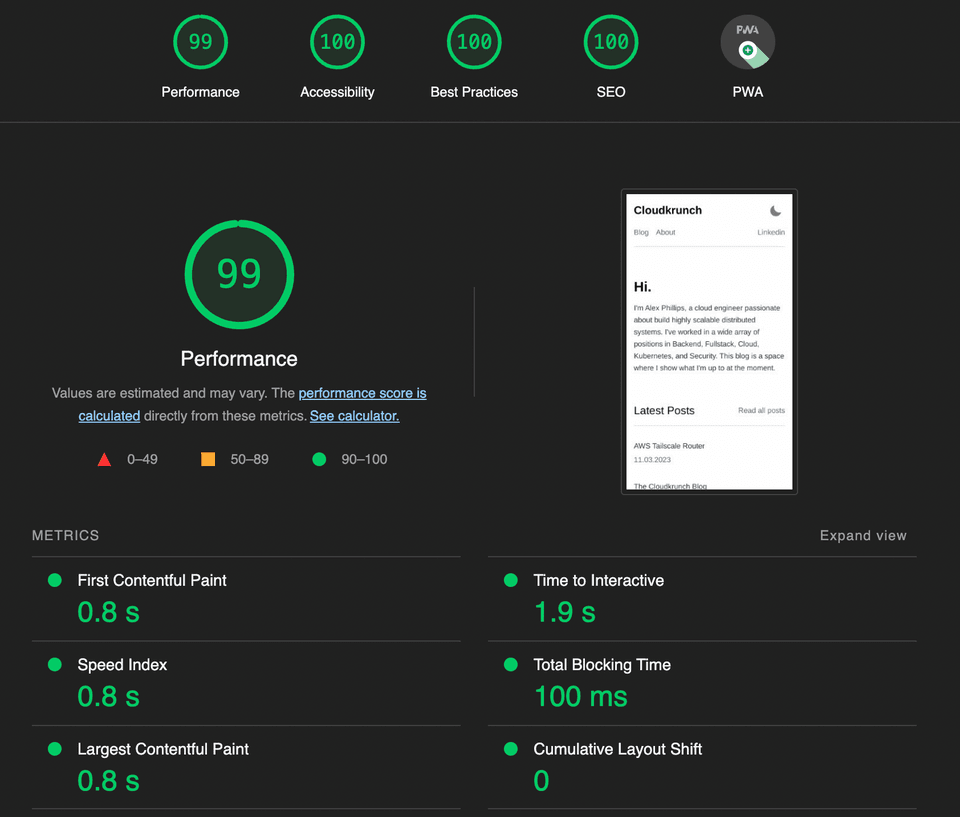
That's all that was needed to get this added to the CICD. Let's take a look at the results it gave me (in the Github Action, it will output a URL to where the results are hosted in GCP).

The results were pretty good. The only thing that could use improvements were that it wasn't a Progressive Web App. I felt that was ok because I'm not really trying to build something that complicated at the moment.
Overview
That's all of it! I hope this showed how a little bit of work can increase productivity and insights into your application. See you on the next CICD improvement project!
Thank you for reading the article and please share it if you thought it was helpful.